That Was Fast!
By Stephen Greco, CEO
That Was Fast!
As October began, we found ourselves enjoying a steady diet of great economic news and a market that was up for the year. What a difference a few weeks makes. Over the last four weeks, essentially every major asset class is down, including bonds, US stocks, and international stocks. Specifically, the S&P 500 is down 8.4%, small-cap stocks are down 12.2%, the Nasdaq is down 10.3%, emerging markets (EEM) are down 10.2%, and international developed markets (EFA) are down 10.9%. We have also seen individual stocks like Amazon (AMZN) and Netflix (NFLX) correct 20% and 30%, respectively, from all-time highs reached earlier this year. Volatility has increased significantly as well, with the VIX (a measure of volatility in the market) opening at 11.99 on October 1st and now sitting at 24.16, essentially doubling in about a month. While the market has had a significant downturn over the last few weeks, we don’t feel it will turn into a recession.
Why is this happening? A few events have popped up over the past several weeks that have driven the market lower.
Interest rates have increased dramatically relative to the last several years.
The average rate on a 30-year mortgage has risen above 5%, a key psychological level, creating some concerns over a possible slowdown in the housing market. In fact, the housing market continued to deteriorate as sales of new homes plunged to near their lowest level in two years. The Commerce Department reported that new-home sales ran at a seasonally-adjusted annual rate of 553,000 last month, their lowest rate since December of 2016. September’s reading was 5.5% lower than August, and 13.2% lower than at the same time last year.
Algorithmic and momentum trading exacerbate market swings.
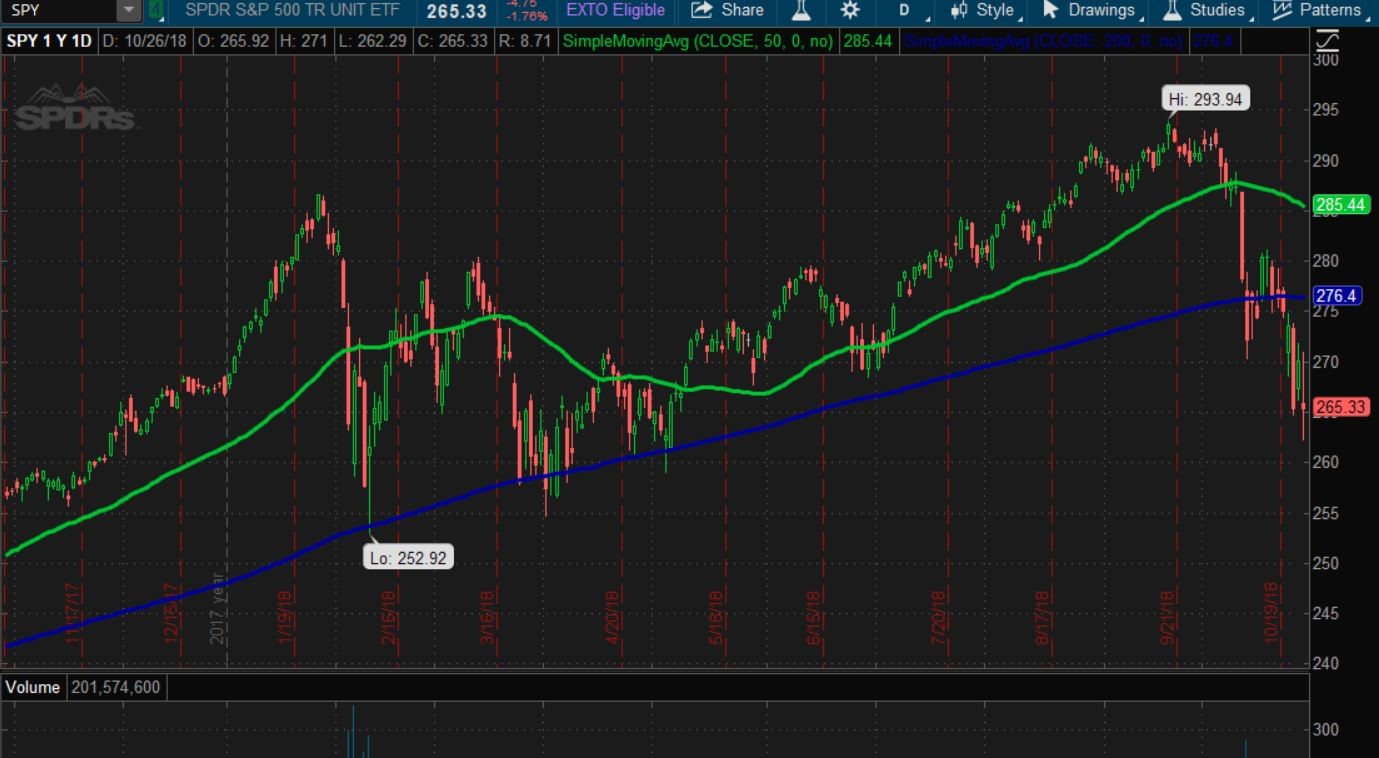
Most of you have probably heard of “black box” or “high frequency” trading, which uses powerful computers to effect huge volumes of stock transactions at extremely high speeds. This type of trading accounts for a significant percentage of all trading in the markets and, as a result, many analysts believe it is a large contributor to the enhanced volatility we see in the market these days. The reason for this is that high frequency trading uses computer-based algorithms to tell an automated trading system when and how to trade based on certain conditions being present. So as soon as a stock or index hits the data point the formula is based on, trades will execute automatically. As this type of trading has proliferated we have seen massive moves in the markets when stocks or indexes breach major technical levels. Below is a chart of the S&P 500. The blue line is the 200-day moving average, which is a widely viewed level for a lot of technical traders. It is also a metric that is used by a lot of computer-based trading systems. As you can see, once the S&P 500 got below the blue line and couldn’t close back above it, you saw a pretty large drop in the index.
SOURCE: thinkorswim® TD Ameritrade, Inc.
An opportune time for profit-taking and deleveraging.
When the markets see increased volatility, positions that are up the most are usually the ones that decrease the most. AMZN and NFLX aren’t dramatically different companies today compared to a couple months ago, yet they have seen massive drops in their stock price. We believe that much of this is a result of profit-taking, deleveraging in the market (i.e. paying off margin balances and reducing overall debt), and companies reducing their estimates to account for some of the new headwinds we have seen in the market.
Going forward, as I stated earlier we don’t expect these conditions to develop into the next recession. The economy is actually very strong with some of the highest GDP numbers in years and unemployment being at record lows.
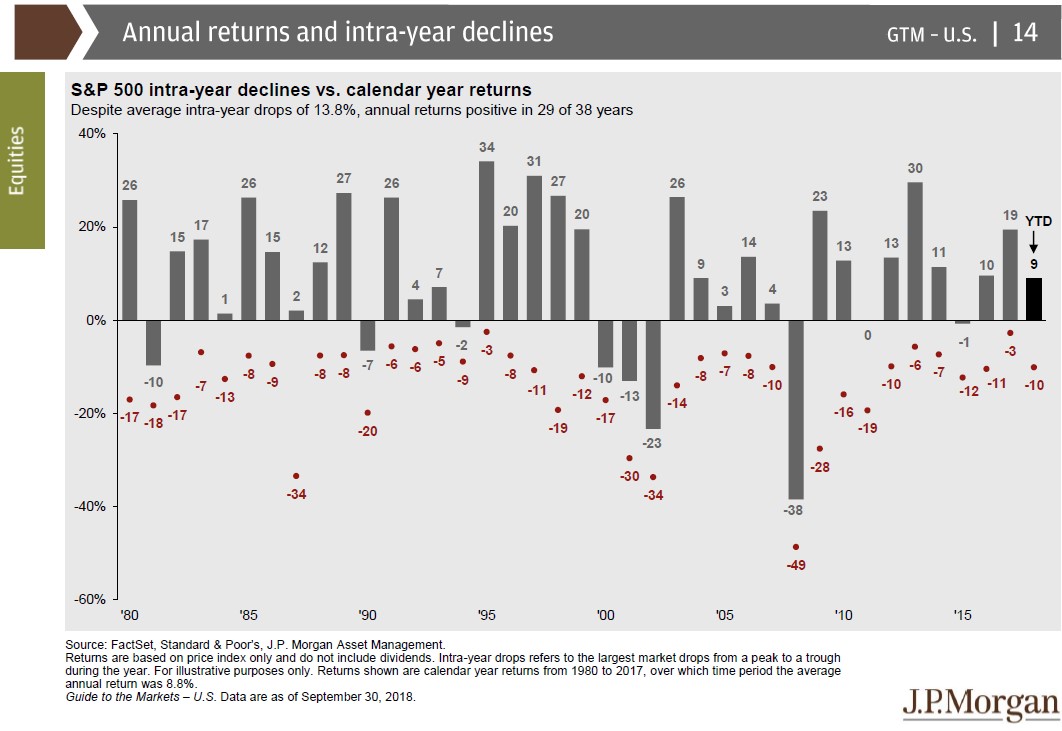
While it is never fun to deal with downturns, they are a normal part of the economic cycle. As you can see in the chart below, markets typically see a decline of 10% or more in most calendar years. Even when the market ends positive for the year, there is usually a downturn at some point.
What isn’t normal, relative to recent history, is the volatility we have seen of late. It used to take months for a market to correct 10%, now it takes weeks or days. We think this volatility is going to stick around for a while, so be prepared. The Federal Reserve has removed most of its stimulus, essentially taking off the market’s training wheels. Anyone with young children knows that, when this happens, very rarely does your child ride off into the sunset on their first try. But after a few falls and some bumps and bruises, they eventually figure it out. We think this is a good analogy for where the market is right now and where it is heading over the next few months. It may be a rough ride with some bumps and bruises to come, but eventually the market will figure it out.
If you have any questions regarding your specific situation or portfolio, please don’t hesitate to contact myself or your Wealth Manager.

Stephen Greco, CEO
Join the Spotlight Asset Group Newsletter
That Was Fast!
By Stephen Greco, CEO
That Was Fast!
As October began, we found ourselves enjoying a steady diet of great economic news and a market that was up for the year. What a difference a few weeks makes. Over the last four weeks, essentially every major asset class is down, including bonds, US stocks, and international stocks. Specifically, the S&P 500 is down 8.4%, small-cap stocks are down 12.2%, the Nasdaq is down 10.3%, emerging markets (EEM) are down 10.2%, and international developed markets (EFA) are down 10.9%. We have also seen individual stocks like Amazon (AMZN) and Netflix (NFLX) correct 20% and 30%, respectively, from all-time highs reached earlier this year. Volatility has increased significantly as well, with the VIX (a measure of volatility in the market) opening at 11.99 on October 1st and now sitting at 24.16, essentially doubling in about a month. While the market has had a significant downturn over the last few weeks, we don’t feel it will turn into a recession.
Why is this happening? A few events have popped up over the past several weeks that have driven the market lower.
Interest rates have increased dramatically relative to the last several years.
The average rate on a 30-year mortgage has risen above 5%, a key psychological level, creating some concerns over a possible slowdown in the housing market. In fact, the housing market continued to deteriorate as sales of new homes plunged to near their lowest level in two years. The Commerce Department reported that new-home sales ran at a seasonally-adjusted annual rate of 553,000 last month, their lowest rate since December of 2016. September’s reading was 5.5% lower than August, and 13.2% lower than at the same time last year.
Algorithmic and momentum trading exacerbate market swings.
Most of you have probably heard of “black box” or “high frequency” trading, which uses powerful computers to effect huge volumes of stock transactions at extremely high speeds. This type of trading accounts for a significant percentage of all trading in the markets and, as a result, many analysts believe it is a large contributor to the enhanced volatility we see in the market these days. The reason for this is that high frequency trading uses computer-based algorithms to tell an automated trading system when and how to trade based on certain conditions being present. So as soon as a stock or index hits the data point the formula is based on, trades will execute automatically. As this type of trading has proliferated we have seen massive moves in the markets when stocks or indexes breach major technical levels. Below is a chart of the S&P 500. The blue line is the 200-day moving average, which is a widely viewed level for a lot of technical traders. It is also a metric that is used by a lot of computer-based trading systems. As you can see, once the S&P 500 got below the blue line and couldn’t close back above it, you saw a pretty large drop in the index.
SOURCE: thinkorswim® TD Ameritrade, Inc.
An opportune time for profit-taking and deleveraging.
When the markets see increased volatility, positions that are up the most are usually the ones that decrease the most. AMZN and NFLX aren’t dramatically different companies today compared to a couple months ago, yet they have seen massive drops in their stock price. We believe that much of this is a result of profit-taking, deleveraging in the market (i.e. paying off margin balances and reducing overall debt), and companies reducing their estimates to account for some of the new headwinds we have seen in the market.
Going forward, as I stated earlier we don’t expect these conditions to develop into the next recession. The economy is actually very strong with some of the highest GDP numbers in years and unemployment being at record lows.
While it is never fun to deal with downturns, they are a normal part of the economic cycle. As you can see in the chart below, markets typically see a decline of 10% or more in most calendar years. Even when the market ends positive for the year, there is usually a downturn at some point.
What isn’t normal, relative to recent history, is the volatility we have seen of late. It used to take months for a market to correct 10%, now it takes weeks or days. We think this volatility is going to stick around for a while, so be prepared. The Federal Reserve has removed most of its stimulus, essentially taking off the market’s training wheels. Anyone with young children knows that, when this happens, very rarely does your child ride off into the sunset on their first try. But after a few falls and some bumps and bruises, they eventually figure it out. We think this is a good analogy for where the market is right now and where it is heading over the next few months. It may be a rough ride with some bumps and bruises to come, but eventually the market will figure it out.
If you have any questions regarding your specific situation or portfolio, please don’t hesitate to contact myself or your Wealth Manager.

Stephen Greco, CEO


