That Was Fast!

That Was Fast!

By Stephen Greco, CEO

That Was Fast!

As October began, we found ourselves enjoying a steady diet of great economic news and a market that was up for the year. What a difference a few weeks makes. Over the last four weeks, essentially every major asset class is down, including bonds, US stocks, and international stocks. Specifically, the S&P 500 is down 8.4%, small-cap stocks are down 12.2%, the Nasdaq is down 10.3%, emerging markets (EEM) are down 10.2%, and international developed markets (EFA) are down 10.9%. We have also seen individual stocks like Amazon (AMZN) and Netflix (NFLX) correct 20% and 30%, respectively, from all-time highs reached earlier this year. Volatility has increased significantly as well, with the VIX (a measure of volatility in the market) opening at 11.99 on October 1st and now sitting at 24.16, essentially doubling in about a month. While the market has had a significant downturn over the last few weeks, we don’t feel it will turn into a recession.

Why is this happening? A few events have popped up over the past several weeks that have driven the market lower.

Interest rates have increased dramatically relative to the last several years.

The average rate on a 30-year mortgage has risen above 5%, a key psychological level, creating some concerns over a possible slowdown in the housing market. In fact, the housing market continued to deteriorate as sales of new homes plunged to near their lowest level in two years. The Commerce Department reported that new-home sales ran at a seasonally-adjusted annual rate of 553,000 last month, their lowest rate since December of 2016. September’s reading was 5.5% lower than August, and 13.2% lower than at the same time last year.

Algorithmic and momentum trading exacerbate market swings.

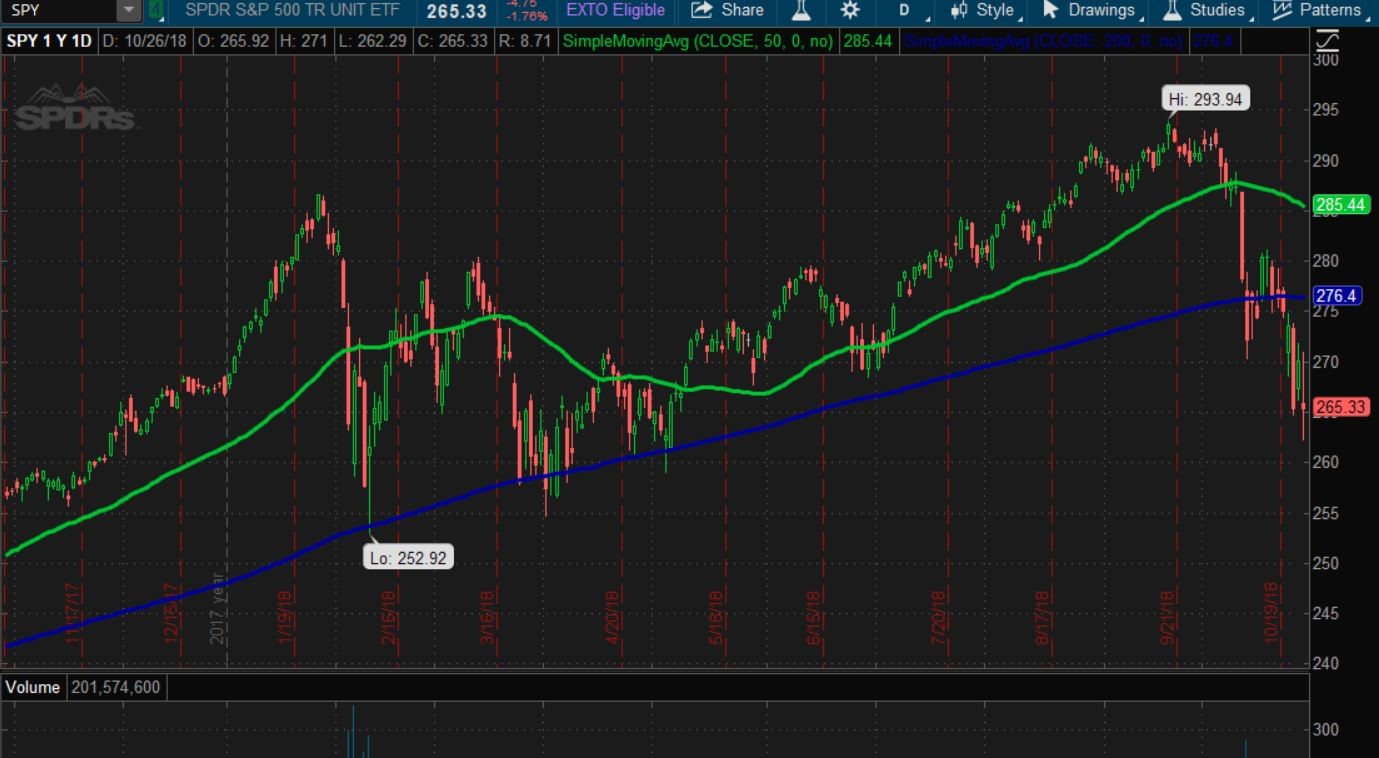
Most of you have probably heard of “black box” or “high frequency” trading, which uses powerful computers to effect huge volumes of stock transactions at extremely high speeds. This type of trading accounts for a significant percentage of all trading in the markets and, as a result, many analysts believe it is a large contributor to the enhanced volatility we see in the market these days. The reason for this is that high frequency trading uses computer-based algorithms to tell an automated trading system when and how to trade based on certain conditions being present. So as soon as a stock or index hits the data point the formula is based on, trades will execute automatically. As this type of trading has proliferated we have seen massive moves in the markets when stocks or indexes breach major technical levels. Below is a chart of the S&P 500. The blue line is the 200-day moving average, which is a widely viewed level for a lot of technical traders. It is also a metric that is used by a lot of computer-based trading systems. As you can see, once the S&P 500 got below the blue line and couldn’t close back above it, you saw a pretty large drop in the index.

SOURCE: thinkorswim® TD Ameritrade, Inc.

SOURCE: thinkorswim® TD Ameritrade, Inc.

An opportune time for profit-taking and deleveraging.

When the markets see increased volatility, positions that are up the most are usually the ones that decrease the most. AMZN and NFLX aren’t dramatically different companies today compared to a couple months ago, yet they have seen massive drops in their stock price. We believe that much of this is a result of profit-taking, deleveraging in the market (i.e. paying off margin balances and reducing overall debt), and companies reducing their estimates to account for some of the new headwinds we have seen in the market.

Going forward, as I stated earlier we don’t expect these conditions to develop into the next recession. The economy is actually very strong with some of the highest GDP numbers in years and unemployment being at record lows.

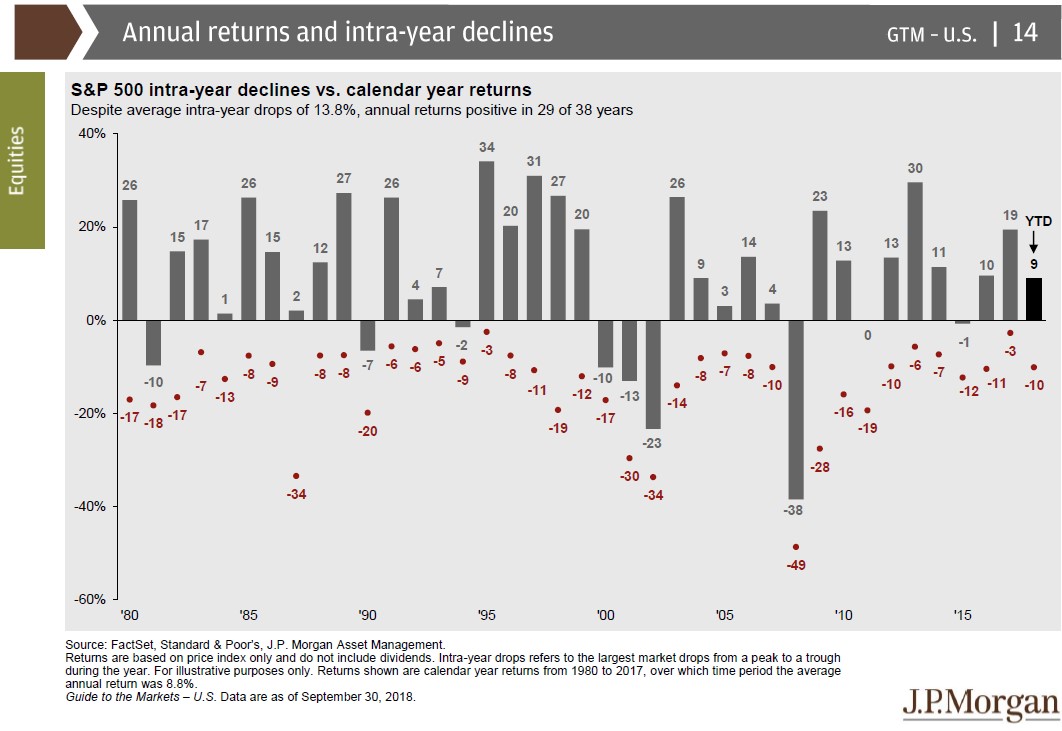
While it is never fun to deal with downturns, they are a normal part of the economic cycle. As you can see in the chart below, markets typically see a decline of 10% or more in most calendar years. Even when the market ends positive for the year, there is usually a downturn at some point.

What isn’t normal, relative to recent history, is the volatility we have seen of late. It used to take months for a market to correct 10%, now it takes weeks or days. We think this volatility is going to stick around for a while, so be prepared. The Federal Reserve has removed most of its stimulus, essentially taking off the market’s training wheels. Anyone with young children knows that, when this happens, very rarely does your child ride off into the sunset on their first try. But after a few falls and some bumps and bruises, they eventually figure it out. We think this is a good analogy for where the market is right now and where it is heading over the next few months. It may be a rough ride with some bumps and bruises to come, but eventually the market will figure it out.

If you have any questions regarding your specific situation or portfolio, please don’t hesitate to contact myself or your Wealth Manager.

Stephen Greco, CEO

Join the Spotlight Asset Group Newsletter

That Was Fast!

By Stephen Greco, CEO

That Was Fast!

As October began, we found ourselves enjoying a steady diet of great economic news and a market that was up for the year. What a difference a few weeks makes. Over the last four weeks, essentially every major asset class is down, including bonds, US stocks, and international stocks. Specifically, the S&P 500 is down 8.4%, small-cap stocks are down 12.2%, the Nasdaq is down 10.3%, emerging markets (EEM) are down 10.2%, and international developed markets (EFA) are down 10.9%. We have also seen individual stocks like Amazon (AMZN) and Netflix (NFLX) correct 20% and 30%, respectively, from all-time highs reached earlier this year. Volatility has increased significantly as well, with the VIX (a measure of volatility in the market) opening at 11.99 on October 1st and now sitting at 24.16, essentially doubling in about a month. While the market has had a significant downturn over the last few weeks, we don’t feel it will turn into a recession.

Why is this happening? A few events have popped up over the past several weeks that have driven the market lower.

Interest rates have increased dramatically relative to the last several years.

The average rate on a 30-year mortgage has risen above 5%, a key psychological level, creating some concerns over a possible slowdown in the housing market. In fact, the housing market continued to deteriorate as sales of new homes plunged to near their lowest level in two years. The Commerce Department reported that new-home sales ran at a seasonally-adjusted annual rate of 553,000 last month, their lowest rate since December of 2016. September’s reading was 5.5% lower than August, and 13.2% lower than at the same time last year.

Algorithmic and momentum trading exacerbate market swings.

Most of you have probably heard of “black box” or “high frequency” trading, which uses powerful computers to effect huge volumes of stock transactions at extremely high speeds. This type of trading accounts for a significant percentage of all trading in the markets and, as a result, many analysts believe it is a large contributor to the enhanced volatility we see in the market these days. The reason for this is that high frequency trading uses computer-based algorithms to tell an automated trading system when and how to trade based on certain conditions being present. So as soon as a stock or index hits the data point the formula is based on, trades will execute automatically. As this type of trading has proliferated we have seen massive moves in the markets when stocks or indexes breach major technical levels. Below is a chart of the S&P 500. The blue line is the 200-day moving average, which is a widely viewed level for a lot of technical traders. It is also a metric that is used by a lot of computer-based trading systems. As you can see, once the S&P 500 got below the blue line and couldn’t close back above it, you saw a pretty large drop in the index.

SOURCE: thinkorswim® TD Ameritrade, Inc.

SOURCE: thinkorswim® TD Ameritrade, Inc.

An opportune time for profit-taking and deleveraging.

When the markets see increased volatility, positions that are up the most are usually the ones that decrease the most. AMZN and NFLX aren’t dramatically different companies today compared to a couple months ago, yet they have seen massive drops in their stock price. We believe that much of this is a result of profit-taking, deleveraging in the market (i.e. paying off margin balances and reducing overall debt), and companies reducing their estimates to account for some of the new headwinds we have seen in the market.

Going forward, as I stated earlier we don’t expect these conditions to develop into the next recession. The economy is actually very strong with some of the highest GDP numbers in years and unemployment being at record lows.

While it is never fun to deal with downturns, they are a normal part of the economic cycle. As you can see in the chart below, markets typically see a decline of 10% or more in most calendar years. Even when the market ends positive for the year, there is usually a downturn at some point.

What isn’t normal, relative to recent history, is the volatility we have seen of late. It used to take months for a market to correct 10%, now it takes weeks or days. We think this volatility is going to stick around for a while, so be prepared. The Federal Reserve has removed most of its stimulus, essentially taking off the market’s training wheels. Anyone with young children knows that, when this happens, very rarely does your child ride off into the sunset on their first try. But after a few falls and some bumps and bruises, they eventually figure it out. We think this is a good analogy for where the market is right now and where it is heading over the next few months. It may be a rough ride with some bumps and bruises to come, but eventually the market will figure it out.

If you have any questions regarding your specific situation or portfolio, please don’t hesitate to contact myself or your Wealth Manager.

Stephen Greco, CEO

The Siren Song of Emerging Markets

The Siren Song of Emerging Markets

By Stephen Greco, CEO

The Siren Song of Emerging Markets

Since making the transition from the broker-dealer side of the industry to the registered investment adviser side, around 2011, no asset class has been more interesting to me than Emerging Markets. By 2011, many investment advisers had fallen in love with Emerging Markets as an asset class and decided to pile significant portions of their clients’ portfolios into this space. Some advisers had well-thought-out arguments that pointed to population growth in these markets, a growing middle class, exceptional performance from 2001 to 2010, and an increased risk premium as factors that should lead to higher returns over an extended period. Other advisers really didn’t have an argument and instead decided to pile into Emerging Markets because it was the “hot” asset class. Even worse, some advisers applied a lazy “gambler’s fallacy” type of logic and reasoned that, because Emerging Markets had a couple lagging years to start the decade, they needed to buy more since it was due to bounce back. “Buy low, it has to come back at some point” is a common refrain I have heard over the years, which really is no different than saying you should bet on black in roulette after red has come up 6 or 7 times in a row. I even saw an article the other day, written by a member of the investment committee of a prominent firm, that stated that investors need to have exposure to foreign stocks, even though they won’t lead to the highest returns. Such advice is emblematic of the “follow the crowd” thinking that has unfortunately become so prevalent in the market. Diversify because you are told to do so, and be happy with lower returns. Shouldn’t we strive for something better? Something more strategic and thoughtful?

To set the context for why this is all so fascinating to me, it is important to understand the returns we have seen from Emerging Markets over the last couple of decades. From 12/31/99 to 12/31/09 the S&P 500 had an average annual return of -2.72% per year. It is a period often referred to as the “Lost Decade” for US stocks, and it was the only decade the S&P 500 recorded a negative annual return according to data that Forbes had collected going back to 1926. Emerging Markets, on the other hand, had an average annual return of 9.78% per year during that same period, out-performing the US stock market by about 12.5% per year for 10 years. That is a tremendous difference and, because of that performance, many advisers started to allocate more and more of their client’s portfolios into Emerging Markets, blindly expecting the same types of returns for this current decade. Unfortunately, they have been horribly wrong. From 12/31/09 to 7/31/18, Emerging Markets had an average annual return of 1.59% per year. Not quite negative like the S&P 500 in the previous decade, but certainly nothing to write home about. In contrast, the S&P 500 had an average annual return of 23.55% per year, or about 22% more each year for the last 8+ years. So what changed?

We believe there are three key questions every investment committee should ask to guide their analysis and make better-informed decisions for their clients:

1) What has happened?
2) What is happening?
3) What do we think will happen going forward?

What has happened?

Gambler’s fallacy aside, we do believe in reversion to the mean and we factor it into our thinking when we develop portfolios. This is simply a fancy way of saying that if something hasn’t done well for an extended period then it should be on our radar because asset classes perform in predictable ranges the longer the period you are measuring. Therefore, if something has done poorly for an extended period, it could do much better than other asset classes in the future. After all, money finds value. The mistake many advisers made, in our opinion, was that they saw underperformance in a small period of time (2011, 2013, 2014) and assumed that things would spring back after that. This is even more mind-boggling when we just came off a decade of underperformance for the S&P 500. After all, if the US markets underperformed for an entire decade, why wouldn’t it be logical to assume that Emerging Markets could do the same? This would be a very simple conclusion to draw, and one that would have been right if they simply would have underweighted the asset class based on the previous out-performance alone. However, while we believe in reversion to the mean, we feel more thought needs to go into investment decisions than that alone.

What is happening?

During the current decade there are a few factors we believe have contributed to the underperformance of Emerging Markets. First, as stated above, money finds value. If an asset class underperforms for more than a decade, at some point people will take notice. Second, we had two extensive declines to the market during the previous decade. In the early part of the 2000’s we had the tech bubble followed up by the financial crisis in 2007 and 2008. These shocks to the market impacted the way investors think. It decreased their appetite for risk and encouraged them to invest in things they were more comfortable with and understood. This led people to invest more in their own backyard (i.e. US stocks). Third, there was a significant drop in interest rates in the decade beginning in 2000. The prime rate, which is the interest rate that many loans are based on, started around 9.5% at the beginning of the decade and decreased to around 3.25% by the end of the decade. The Federal Reserve tries to keep rates low to stimulate investing and risk-taking, so this incredible movement in rates really helped prop up Emerging Markets. In the current decade, we have seen an increase in rates from 3.25% to 5.00%. It isn’t a tremendous increase, but the bottom line is that rates have gone up, which hurts the riskier asset classes, including Emerging Markets. Lastly, over the past two years, the Trump administration has emphasized an “America First” approach to, among other things, US trade policy. Specifically, the administration has been aggressively trying to renegotiate trade deals to America’s benefit. This has caused more concern for Emerging Markets, especially in China, which has been singled out as the primary trade offender by the Trump administration. China represents about 30% of the Emerging Markets Index. So, what should investors do? Think about the future.

What do we think will happen going forward?

Now that Emerging Markets has significantly underperformed for the last 8.5 years, we feel it is time for investors to take notice. It isn’t a sign in and of itself that investors should allocate more to Emerging Markets, but it is a step in that direction. We also want to look at P/E ratios compared to historical norms. Currently, the S&P 500 is trading at a P/E ratio of 24.06 based on forward looking metrics (see the Wall Street Journal link, below). Emerging Markets is trading at a P/E ratio of 11.45 based on forward expected earnings as of 7/31/18. While we expect interest rates to continue to rise over the next couple of years, we think the pace of these hikes will slow. Since 2015 we have seen six interest rate increases totaling 1.75%. We expect three more hikes over the next couple of years, which would not be as significant as what we have seen previously. Lastly, we think the political climate is starting to take a turn towards completing trade deals, rather than imposing tariffs. Republicans have been more vocal about tariffs than they have about any other areas of disagreement with the President. Trade is becoming a big issue in several swing districts, and we expect to see the administration work feverishly to get as many deals done as possible before the mid-term elections. We saw that this week with the US and Mexico nearing an agreement on a trade deal. Canada appears to be next, and the administration continues to negotiate with China as well.

Based on these factors, we think it is a good time to allocate more capital to Emerging Markets. Clients have already received a newsletter with our specific trades. For any prospective clients that are interested in our investment philosophy or services, please don’t hesitate to contact me at [email protected] or by phone at 630-230-6840.

Links:


Stephen Greco, CEO

Join the Spotlight Asset Group Newsletter

The Siren Song of Emerging Markets

By Stephen Greco, CEO

The Siren Song of Emerging Markets

Since making the transition from the broker-dealer side of the industry to the registered investment adviser side, around 2011, no asset class has been more interesting to me than Emerging Markets. By 2011, many investment advisers had fallen in love with Emerging Markets as an asset class and decided to pile significant portions of their clients’ portfolios into this space. Some advisers had well-thought-out arguments that pointed to population growth in these markets, a growing middle class, exceptional performance from 2001 to 2010, and an increased risk premium as factors that should lead to higher returns over an extended period. Other advisers really didn’t have an argument and instead decided to pile into Emerging Markets because it was the “hot” asset class. Even worse, some advisers applied a lazy “gambler’s fallacy” type of logic and reasoned that, because Emerging Markets had a couple lagging years to start the decade, they needed to buy more since it was due to bounce back. “Buy low, it has to come back at some point” is a common refrain I have heard over the years, which really is no different than saying you should bet on black in roulette after red has come up 6 or 7 times in a row. I even saw an article the other day, written by a member of the investment committee of a prominent firm, that stated that investors need to have exposure to foreign stocks, even though they won’t lead to the highest returns. Such advice is emblematic of the “follow the crowd” thinking that has unfortunately become so prevalent in the market. Diversify because you are told to do so, and be happy with lower returns. Shouldn’t we strive for something better? Something more strategic and thoughtful?

To set the context for why this is all so fascinating to me, it is important to understand the returns we have seen from Emerging Markets over the last couple of decades. From 12/31/99 to 12/31/09 the S&P 500 had an average annual return of -2.72% per year. It is a period often referred to as the “Lost Decade” for US stocks, and it was the only decade the S&P 500 recorded a negative annual return according to data that Forbes had collected going back to 1926. Emerging Markets, on the other hand, had an average annual return of 9.78% per year during that same period, out-performing the US stock market by about 12.5% per year for 10 years. That is a tremendous difference and, because of that performance, many advisers started to allocate more and more of their client’s portfolios into Emerging Markets, blindly expecting the same types of returns for this current decade. Unfortunately, they have been horribly wrong. From 12/31/09 to 7/31/18, Emerging Markets had an average annual return of 1.59% per year. Not quite negative like the S&P 500 in the previous decade, but certainly nothing to write home about. In contrast, the S&P 500 had an average annual return of 23.55% per year, or about 22% more each year for the last 8+ years. So what changed?

We believe there are three key questions every investment committee should ask to guide their analysis and make better-informed decisions for their clients:

1) What has happened?
2) What is happening?
3) What do we think will happen going forward?

What has happened?

Gambler’s fallacy aside, we do believe in reversion to the mean and we factor it into our thinking when we develop portfolios. This is simply a fancy way of saying that if something hasn’t done well for an extended period then it should be on our radar because asset classes perform in predictable ranges the longer the period you are measuring. Therefore, if something has done poorly for an extended period, it could do much better than other asset classes in the future. After all, money finds value. The mistake many advisers made, in our opinion, was that they saw underperformance in a small period of time (2011, 2013, 2014) and assumed that things would spring back after that. This is even more mind-boggling when we just came off a decade of underperformance for the S&P 500. After all, if the US markets underperformed for an entire decade, why wouldn’t it be logical to assume that Emerging Markets could do the same? This would be a very simple conclusion to draw, and one that would have been right if they simply would have underweighted the asset class based on the previous out-performance alone. However, while we believe in reversion to the mean, we feel more thought needs to go into investment decisions than that alone.

What is happening?

During the current decade there are a few factors we believe have contributed to the underperformance of Emerging Markets. First, as stated above, money finds value. If an asset class underperforms for more than a decade, at some point people will take notice. Second, we had two extensive declines to the market during the previous decade. In the early part of the 2000’s we had the tech bubble followed up by the financial crisis in 2007 and 2008. These shocks to the market impacted the way investors think. It decreased their appetite for risk and encouraged them to invest in things they were more comfortable with and understood. This led people to invest more in their own backyard (i.e. US stocks). Third, there was a significant drop in interest rates in the decade beginning in 2000. The prime rate, which is the interest rate that many loans are based on, started around 9.5% at the beginning of the decade and decreased to around 3.25% by the end of the decade. The Federal Reserve tries to keep rates low to stimulate investing and risk-taking, so this incredible movement in rates really helped prop up Emerging Markets. In the current decade, we have seen an increase in rates from 3.25% to 5.00%. It isn’t a tremendous increase, but the bottom line is that rates have gone up, which hurts the riskier asset classes, including Emerging Markets. Lastly, over the past two years, the Trump administration has emphasized an “America First” approach to, among other things, US trade policy. Specifically, the administration has been aggressively trying to renegotiate trade deals to America’s benefit. This has caused more concern for Emerging Markets, especially in China, which has been singled out as the primary trade offender by the Trump administration. China represents about 30% of the Emerging Markets Index. So, what should investors do? Think about the future.

What do we think will happen going forward?

Now that Emerging Markets has significantly underperformed for the last 8.5 years, we feel it is time for investors to take notice. It isn’t a sign in and of itself that investors should allocate more to Emerging Markets, but it is a step in that direction. We also want to look at P/E ratios compared to historical norms. Currently, the S&P 500 is trading at a P/E ratio of 24.06 based on forward looking metrics (see the Wall Street Journal link, below). Emerging Markets is trading at a P/E ratio of 11.45 based on forward expected earnings as of 7/31/18. While we expect interest rates to continue to rise over the next couple of years, we think the pace of these hikes will slow. Since 2015 we have seen six interest rate increases totaling 1.75%. We expect three more hikes over the next couple of years, which would not be as significant as what we have seen previously. Lastly, we think the political climate is starting to take a turn towards completing trade deals, rather than imposing tariffs. Republicans have been more vocal about tariffs than they have about any other areas of disagreement with the President. Trade is becoming a big issue in several swing districts, and we expect to see the administration work feverishly to get as many deals done as possible before the mid-term elections. We saw that this week with the US and Mexico nearing an agreement on a trade deal. Canada appears to be next, and the administration continues to negotiate with China as well.

Based on these factors, we think it is a good time to allocate more capital to Emerging Markets. Clients have already received a newsletter with our specific trades. For any prospective clients that are interested in our investment philosophy or services, please don’t hesitate to contact me at [email protected] or by phone at 630-230-6840.

Links:


Stephen Greco, CEO

The Rational View

The Rational View

By Stephen Greco, CEO

The Rational View: How We Try to Stay Rational in an Irrational World

“If investing is entertaining, if you’re having fun, you’re probably not making any money. Good investing is boring.” — George Soros

So far, Q2 2018 has been rather dull, at least relative to Q1. After a year of almost no volatility, Q1 saw the S&P 500 move by at least 1% for the day roughly 30% of the trading days, or, in other words, one out of every three. Adding salt to the wound, the S&P 500 had its first correction since early 2016, losing a little more than 9% from its late January peak. Enter Q2: Volatility has not disappeared, but it has slowed for the moment. The number of days in which S&P 500 moved by at least 1% for the day decreased to 17% through late May. Also, the market has turned positive with the S&P 500 currently up about 3.0% YTD. Pairing the S&P 500 performance with an unemployment rate of 3.8%, consumer confidence at 98.9, and the year-on-year rate of the core consumer price index holding steady at 2.1%, leads us to acknowledge that we are still in a stable, yet mature economy.

This leads us to a question, “Has the stock market been more volatile than normal, or have we, as investors, overreacted?” We can answer this question by using a measurement commonly referred to as the “Fear Index” or the VIX. The VIX is a ticker symbol for the Chicago Board Options Exchange (CBOE) Volatility Index. This index allows one to measure the implied volatility of the S&P 500 over the next 30-day period. The higher the VIX prices, the greater the perceived volatility. But what is normal?

  • The Harmonic Mean of VIX from 11/01/2007-05/18/2018 had a baseline measurement of 17.24
  • March 06, 2009, the day the S&P 500 touched a low of 666.79, the VIX had a high for the day of 51.95.
  • Q1 2018 produced a mean VIX value of 15.4
  • Q2 produced a mean VIX value of 16.4

The conclusion: the VIX has remained below historical norms so people may have overreacted.

Hold on to your horses, there is more to the story than just the measurement of VIX. How we feel depends on what we are used to. If you are used to 75-degree weather and you visit an area, where the temperature is 55 degrees, you will feel cold, even though 55 degrees is above freezing and, in some areas, (Michigan or Illinois) considered shorts weather. The same is true with investing. When we experience a market with very little volatility, we are taken aback when any amount of volatility enters the market. In 2017, the mean VIX value was 11.04. We saw a 39.5% increase in the value of VIX or the implied volatility of the S&P 500 in Q1 2018, which is enough to shock any retail investor.

Has 2018 been a volatile year in the stock market? No, at least according to the VIX, we have experienced less implied volatility than in the last ~9 years. However, were we spoiled by consistency of the 2017 stock market? Yes, and the feeling of increased volatility is real as the VIX jumped 39.5% from the 2017 mean to Q1 2018. So, what are we to do?

Successful investing requires that we take the rational view. As Ben Graham pointed out in The Intelligent Investor, the market is there to serve us… not to inform us. We desire to be risk-intelligent, controlling and managing rather than seeking or avoiding risk. One of the most obvious methods for doing this is by only investing in things we think we can value. We pay little attention to short-term price fluctuations, much preferring the perspective of value. That is, we ask the question, what is an asset worth and what is it currently selling for?

When you get towards the end of a market cycle, we find that novice investors are influenced more by recent events and the potential all-alluring excitement of immediate-term higher returns. Eventually the fear of missing out (FOMO) leads them to give in, throwing more and more resources towards the “highest earning investments.” Eventually the piper calls. On the other end of the spectrum, risk-intelligent investors seek extremely attractive, asymmetric risk-reward opportunities. They tend to notice valuations at obviously unsustainable levels. They increase their cash and short positions. During this phase of a market cycle there are no more non-pros to bid up prices and the pros have already taken a pause. Hence, prices seemingly have nowhere else to go but down.

Today’s animal spirits

At the moment we feel a bit bi-polar because there are a handful of reasons to be both optimistic and pessimistic.

On the bright side,

  1. interest rates are still at essentially historic lows,
  2. the Trump administration is dead-set on pro-growth policy, and
  3. unemployment is at multi-decade lows.

On the (potentially) gloomy side,

  1. debt has begun reaching pre-crisis highs, and
  2. valuations overall are still somewhat frothy on the expectation interest rates will stay low and economic expansion will continue.

Through it all, we are continuously on the hunt for quality, undervalued companies. They’ve been more difficult to discover given today’s pricing, but we remain confident in our ability to find opportunity. The hunt can get tedious, “boring” even, but again, that is good investing.


Stephen Greco, CEO

Join the Spotlight Asset Group Newsletter

The Rational View

By Stephen Greco, CEO

The Rational View: How We Try to Stay Rational in an Irrational World

“If investing is entertaining, if you’re having fun, you’re probably not making any money. Good investing is boring.” — George Soros

So far, Q2 2018 has been rather dull, at least relative to Q1. After a year of almost no volatility, Q1 saw the S&P 500 move by at least 1% for the day roughly 30% of the trading days, or, in other words, one out of every three. Adding salt to the wound, the S&P 500 had its first correction since early 2016, losing a little more than 9% from its late January peak. Enter Q2: Volatility has not disappeared, but it has slowed for the moment. The number of days in which S&P 500 moved by at least 1% for the day decreased to 17% through late May. Also, the market has turned positive with the S&P 500 currently up about 3.0% YTD. Pairing the S&P 500 performance with an unemployment rate of 3.8%, consumer confidence at 98.9, and the year-on-year rate of the core consumer price index holding steady at 2.1%, leads us to acknowledge that we are still in a stable, yet mature economy.

This leads us to a question, “Has the stock market been more volatile than normal, or have we, as investors, overreacted?” We can answer this question by using a measurement commonly referred to as the “Fear Index” or the VIX. The VIX is a ticker symbol for the Chicago Board Options Exchange (CBOE) Volatility Index. This index allows one to measure the implied volatility of the S&P 500 over the next 30-day period. The higher the VIX prices, the greater the perceived volatility. But what is normal?

  • The Harmonic Mean of VIX from 11/01/2007-05/18/2018 had a baseline measurement of 17.24
  • March 06, 2009, the day the S&P 500 touched a low of 666.79, the VIX had a high for the day of 51.95.
  • Q1 2018 produced a mean VIX value of 15.4
  • Q2 produced a mean VIX value of 16.4

The conclusion: the VIX has remained below historical norms so people may have overreacted.

Hold on to your horses, there is more to the story than just the measurement of VIX. How we feel depends on what we are used to. If you are used to 75-degree weather and you visit an area, where the temperature is 55 degrees, you will feel cold, even though 55 degrees is above freezing and, in some areas, (Michigan or Illinois) considered shorts weather. The same is true with investing. When we experience a market with very little volatility, we are taken aback when any amount of volatility enters the market. In 2017, the mean VIX value was 11.04. We saw a 39.5% increase in the value of VIX or the implied volatility of the S&P 500 in Q1 2018, which is enough to shock any retail investor.

Has 2018 been a volatile year in the stock market? No, at least according to the VIX, we have experienced less implied volatility than in the last ~9 years. However, were we spoiled by consistency of the 2017 stock market? Yes, and the feeling of increased volatility is real as the VIX jumped 39.5% from the 2017 mean to Q1 2018. So, what are we to do?

Successful investing requires that we take the rational view. As Ben Graham pointed out in The Intelligent Investor, the market is there to serve us… not to inform us. We desire to be risk-intelligent, controlling and managing rather than seeking or avoiding risk. One of the most obvious methods for doing this is by only investing in things we think we can value. We pay little attention to short-term price fluctuations, much preferring the perspective of value. That is, we ask the question, what is an asset worth and what is it currently selling for?

When you get towards the end of a market cycle, we find that novice investors are influenced more by recent events and the potential all-alluring excitement of immediate-term higher returns. Eventually the fear of missing out (FOMO) leads them to give in, throwing more and more resources towards the “highest earning investments.” Eventually the piper calls. On the other end of the spectrum, risk-intelligent investors seek extremely attractive, asymmetric risk-reward opportunities. They tend to notice valuations at obviously unsustainable levels. They increase their cash and short positions. During this phase of a market cycle there are no more non-pros to bid up prices and the pros have already taken a pause. Hence, prices seemingly have nowhere else to go but down.

Today’s animal spirits

At the moment we feel a bit bi-polar because there are a handful of reasons to be both optimistic and pessimistic.

On the bright side,

  1. interest rates are still at essentially historic lows,
  2. the Trump administration is dead-set on pro-growth policy, and
  3. unemployment is at multi-decade lows.

On the (potentially) gloomy side,

  1. debt has begun reaching pre-crisis highs, and
  2. valuations overall are still somewhat frothy on the expectation interest rates will stay low and economic expansion will continue.

Through it all, we are continuously on the hunt for quality, undervalued companies. They’ve been more difficult to discover given today’s pricing, but we remain confident in our ability to find opportunity. The hunt can get tedious, “boring” even, but again, that is good investing.


Stephen Greco, CEO